Fuel consumption control. How to save with a new calculation algorithm

8 January, 2018
Kirill Yakynin
5ebebb23d11ea

To begin, let's clarify the general concept of fuel consumption control. Fuel consumption control is a critical aspect of modern fleet management, helping companies optimize costs and reduce their environmental footprint.

Half a year ago we updated the proprietary fuel consumption calculation algorithm to offer Wialon users a more flexible, precise, and efficient solution.In today’s article, we will tell about how our partners live with the new opportunities, how they deliver never yet seen projects and how they are doing great without FLS (Fuel level sensor) just relying on simple Math and their own mind flexibility.

Until March Wialon Hosting update, there were two ways to identify fuel consumption: by rates and by math. In the first case, to get the result you needed to multiply the rate by mileage. For instance, multiply 30 liters by 500 km that the trucker covered in a day. In the second case, you needed to take idling, urban, and suburban fuel consumption rates into consideration. It is simple for those who don’t care about accuracy but only about the drivers to fit in the rates by any means.

After the update, fuel consumption module was enhanced and became more flexible due to the use of engine efficiency sensors. They allow to set an individual consumption value with different load (by rpm) and under special circumstances (for example, machinery movement through a thick snow layer).

Initially, this innovation caused much discussion. But with the course of time, a new calculation method proved to be highly efficient. Later, in the “Advanced” tab, we implemented the function similar to that of the calculation by rates. But it was done more for the sake of an end-user not always eager to see into the technical issues. Among those updates that were introduced to make the work easier were:

  • Idling rate transfer from “Fuel consumption” tab into the engine ignition (efficiency) sensor configuration. And it is a logical thing after we have introduced the “dependence” between consumption rate and the above-mentioned sensor. Previously, if the fuel was being dumped at a killed engine and in a volume less than idling rate (for instance, the rate is 2 l/h but the driver was draining fuel at 1 l/h), the theft was not displayed in reports. Now, if the engine ignition sensor is off, any fuel wastage (above the min. value specified in the settings to avoid “fake” thefts) will be considered a theft regardless the rate. In other words, if the engine is started, the idling rate is taken into account, otherwise – it isn’t.
  • Effective control of units for which fuel is written off by engine hours, i.e. taking into account the work of deck or attachable equipment (construction machinery, loaders). This was made possible thanks to the use of the engine efficiency sensor as a consumption rate coefficient.
  • Introduction of a long-awaited “Fuel traffic” report where there is data on fillings, thefts and work intervals of the unit counter sensor.
  • Calibration table import/export. If you use special devices when calibrating the tank, you should know how hard it is to manually pass all the values to Wialon. Now you don’t have to do it thanks to a new option of importing .csv and .txt files with needed data as well as exporting calibration tables in .csv format.

Seasonal coefficient calculator

“Navigator” LLC, our partner from the Russian Federation, highly appreciated the new “Fuel Consumption” module functionality. They developed a seasonal coefficient calculator and came up with the formula of fuel consumption calculation by speed and without FLS or other sensors. To prove the efficiency of the new algorithm, the company carried out a comparative study of fuel consumption by math and engine efficiency sensor that emulated FLS.Initial data:

  • Idle run and speed as basic parameters of fuel consumption;
  • Tractor units with FLS installed;
  • Data on mileage, overall and average fuel consumption by FLS.

The rate of 30 liters per 100 km turned out to be true only at 60 km speed. Actual consumption was different depending on the speed:

Seasonal coefficient calculator


In our partner’s example, a heavy truck covered 12.2% of the distance at speed less than 60 km/h, and average consumption by FLS was 32.53 liters per 100 km.

Now we have to enter this data into the system. We create engine efficiency sensor with “speed” parameter and open a calculation table. By working with XY pairs we enter the appropriate speed intervals in X column. In Y column we enter the coefficient instead of the rate. Its calculation formula was tested out:

Y=((rate l/100 km/(100/km/h speed))/2)*(1.6/idling run rate l/h), where 1.6 is an additional coefficient for Scania trucks idling run rate.

To calculate Y you can use the calculator that was developed by our partner.

For example, if the rate is 5 l/h, we get this table with coefficients for different speed intervals.

Seasonal coefficient calculator

Knowing the idling rate for Scania heavy trucks, we applied this configuration to other units of the same heavy truck modification and got the following result:

Seasonal coefficient calculator

It is almost identical to the one we got with FLS. If we use this formula for other trucks rates, we can calculate consumption without fuel level and other sensors. And it is just by speed! Any number of sensors can be added while using this calculation mechanism. For instance:

  • axle load; 
  • vehicle gear; 
  • tire pressure;
  • heater work, etc. 

It all provides precise fuel consumption control even without FLS.

Fuel control on slow-moving vehicles

Now let’s talk about how to solve previously unmanageable issues using FLS. The client deals with oil-well drilling. His machinery appears at the needed location where it is being filled. After the work is finished, the fuel gets dumped and the machinery moves to another location. The issue was that the fuel consumption rate of such machinery was 300 liters per hour but the fuel was dumped at 150 liters per hour and at a killed engine. This fact made it impossible to display thefts that were automatically put into “Consumed by FLS” statistics section because the consumption was within the specified range regardless the engine not working. The client was not happy about it. The issue of course was solved before the update. But let’s compare the solution before and after it. As we call it, feel the difference!

Seasonal coefficient calculator

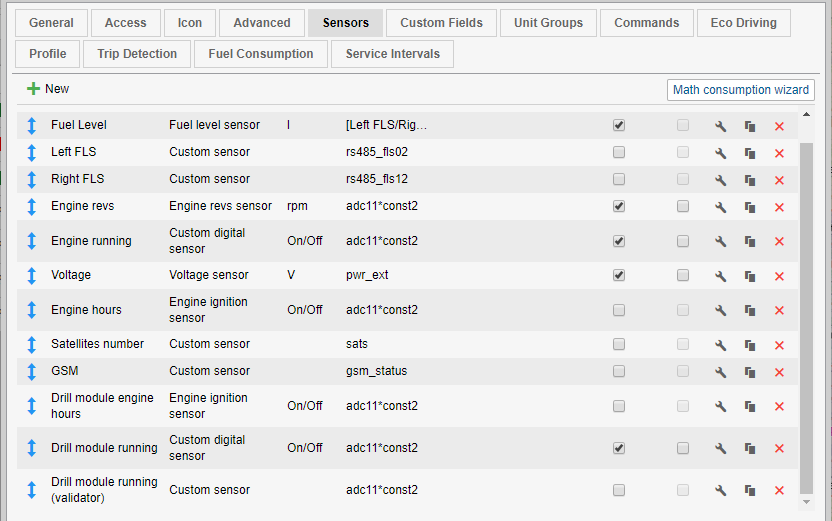
With a new fuel control algorithm we got rid of the “crutches”: we managed to eliminate several already unnecessary validator sensors (speed, engine ignition) and to create an engine efficiency sensor “Machinery engine hours” using a single consumption rate coefficient without the need to set the consumption rate for each individual sensor. Multiplying the rate by coefficient we get an on-load consumption.

On top of that, due to the option of putting the rate for the work of an engine under different load into the “Engine hours” table, it is easy to add the “Consumed by rate” column with a view to “rate*time” regardless the movement.

Previously, to do that you created:

  • the constant (const) for fuel consumption in liters per second;
  • additional FLS with data from a previous message;
  • Instant fuel consumption sensor with (time-#time)*const0.0023333333333333 parameter;

… and then made a “Consumed by instant fuel consumption sensor” column and renamed it into “Consumed by rates”, i.e. how much fuel was spent for these seconds between the messages. See how much of extra work you don’t do now?

All these allowed to considerably reduce the number of custom sensors and therefore to spend less time on configuring and to reduce the error probability.

Seasonal coefficient calculator

So, having used new options we got:

  1. Accurate theft detection when the engine is killed;
  2. Set idling run rate (up to 1100 rpm) of 50 liters per hour;
  3. Set on-load fuel consumption rate (more than 1100 rpm) of 300 liters per hour.

Therefore, we are not always wrong when replacing an old handy and popular function with a new one. For the first 6 months of a new calculation method usage, it proved to be 100% efficient. And it was confirmed by both integrators and their clients.

*Wialon fuel control module

Our module allows to:

  • Identify fuel consumption via the data from CAN-bus and different types of FLS and counters;
  • View the history of fuel level changes in the tank for a certain period in the form of charts and tables;
  • Get reports on all fillings and thefts in the form of a table specifying the date, time, location, initial/final fuel levels and filling/theft volume;
  • Analyze actual fuel consumption and correlate it with the rates. It gives a good chance to estimate how much fuel was saved or overspent by one vehicle or the whole motor park;
  • Swiftly get notifications on thefts and fillings via e-mail, SMS, in a browser or a pop-up window.

According to Gurtam partners, Wialon usage helps to save up to 15% of fuel and to reduce thefts by 90%. The system introduction pays off in 3-4 months. Such monitoring has proven to discipline drivers and to effectively plan the motor park work. Gurtam own calculation algorithm, the possibility to get full analytics, using video to prevent fuel theft make Wialon a head higher than similar programs.

We appreciate your contribution to Wialon development and thank you for your support. Together we will make Wialon even better. Share your experience with us at marketing@gurtam.com so that we could publish it on our blog.

Kirill Yakynin
Kirill Yakynin
Kirill is the Brand Manager at Gurtam. He maintains brand integrity across all the company’s marketing initiatives and communications and ensures that Gurtam products resonate with current and potential customers.

Share

Related articles