Exploring the world of IoT for business with Gurtam
Software solutions encompassing 22 years of industry experience.
Products chosen by hundreds of service providers and thousands of fleet owners in 160+ countries.
Gurtam is a software development company providing IoT solutions with a focus on fleet tracking. Our portfolio includes niche and ultimate products, cloud- and server-based platforms, telematics backend system and mobile apps for personal use. Choose a vehicle tracking platform that aligns best with your business needs.
in telematics and IoT industry
where our solutions are used daily
delivered to the customers
connected to Gurtam products
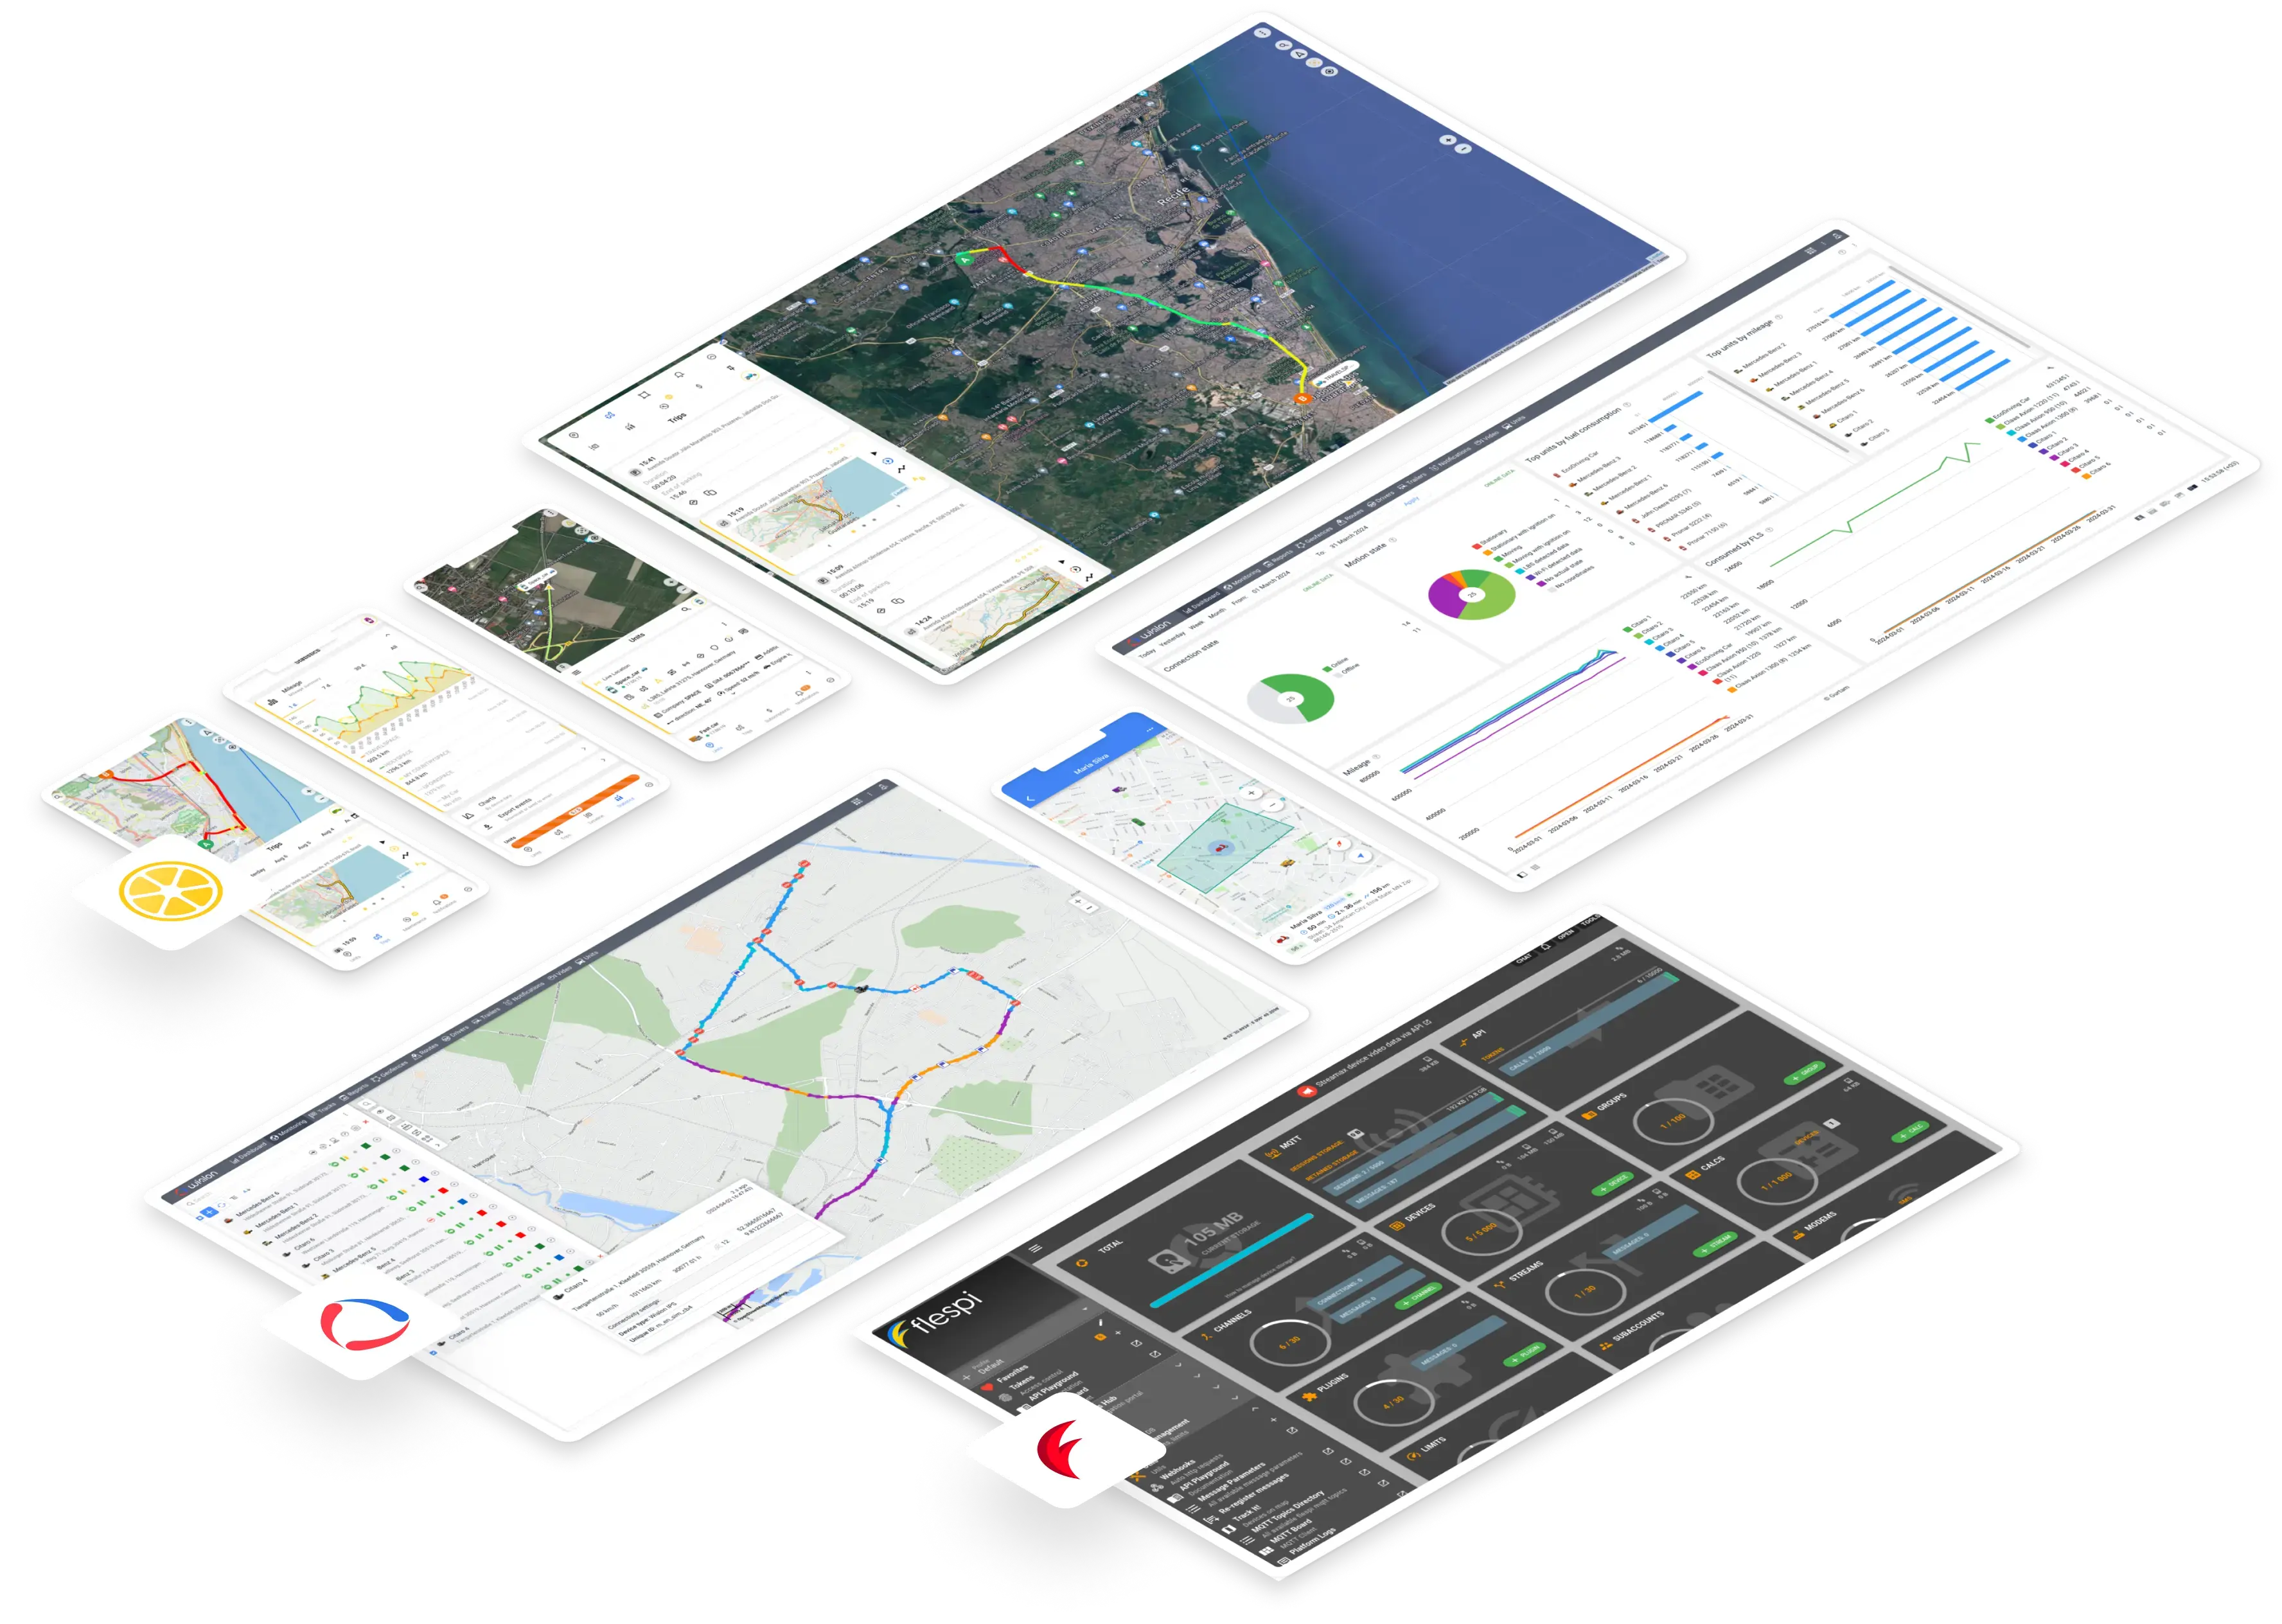
An ultimate fleet digitalization solution that offers real-time insights, robust reporting tools, and industry-tailored functionality. It empowers businesses to streamline operations and enhance their fleet efficiency, making it an invaluable asset for fleet management and optimization.
An API-first telematics & IoT backend. The platform enables the aggregation of normalized data from a variety of sources, manages devices over the air, enriches messages, and analyzes data in real-time.
A set of easy-to-use GPS tracking applications with the possibility of free use. Key features include real-time tracking, analytics, notifications, history and reports, making it ideal for users needing straightforward GPS tracking solutions.

Gurtam is recognized as one of the world’s best companies in terms of software development for telematics. Any business that requires fleet tracking services, accurate planning, and automation of routine processes can use our solutions.
Thus, Gurtam has become the leading player in the global fleet management market. We control the location and condition of over 5,000,000 vehicles and other assets owned by individuals, companies of different sizes, and giant corporations.
Software solutions encompassing 22 years of industry experience.
Products chosen by hundreds of service providers and thousands of fleet owners in 160+ countries.
Wialon works with 3,300+ types of devices and tracks over 4 million units worldwide, from cars and trucks to field workers and various equipment.
Join the biggest community of telematics and IoT professionals. Learn, network, collaborate, share and build stronger businesses backed by international expertise.
Use an open API to develop a targeted solution perfectly integrated into the current business environment for seamless processes.
Get data from any hardware and send it to multiple monitoring systems, IoT and BI platforms simultaneously.
Modify and enrich received telemetry messages as per specific business needs: add or remove parameters, inject data from third-party services, script custom parsing, and more.
Сonfigure telematics devices from various manufacturers in a single feature-rich interface, via API or SMS.
Connect GPS trackers to our easy-to-use apps in a few clicks. The platform is compatible with 2,000+ device models.
Be aware of what’s up with your small business fleet, or what’s going on with your car, and track your beloved pet by downloading free GPS-Trace apps.
Get a simple and convenient tool for reselling GPS tracking services in your region. Expand the portfolio of your services with user-friendly, cross-platform apps.
For more than two decades, we have been developing products for tracking vehicles and other assets. Over this time, our software products that used to be a merely vehicle tracking platform turned into multifunctional and flexible systems. These systems now encompass a wide range of capabilities: from monitoring various parameters to providing in-depth analytics for any chosen period of time.
Today, various research agencies regularly name Gurtam as one of the leading software developers for telematics and IoT.

The company brings together top-tier industry experts: software developers, analysts, cartography and GPS hardware specialists, as well as managers offering guidance to clients on leveraging vehicle tracking systems across different business sectors. Working together, we create cutting-edge products that are utilized by millions of users worldwide.
As Gurtam continues to grow, we are actively seeking new talents to join us. Don’t miss out the opportunity to become part of our team!


If you want to work with Gurtam, let us know!

Your request has been submitted successfully.